Tracking a single skin tells you what one item is worth. Tracking an index tells you where the entire market is moving. The S&P 500 isn't useful because it measures one company — it's useful because it shows you what's happening to all of them at once. The same logic applies to CS2.
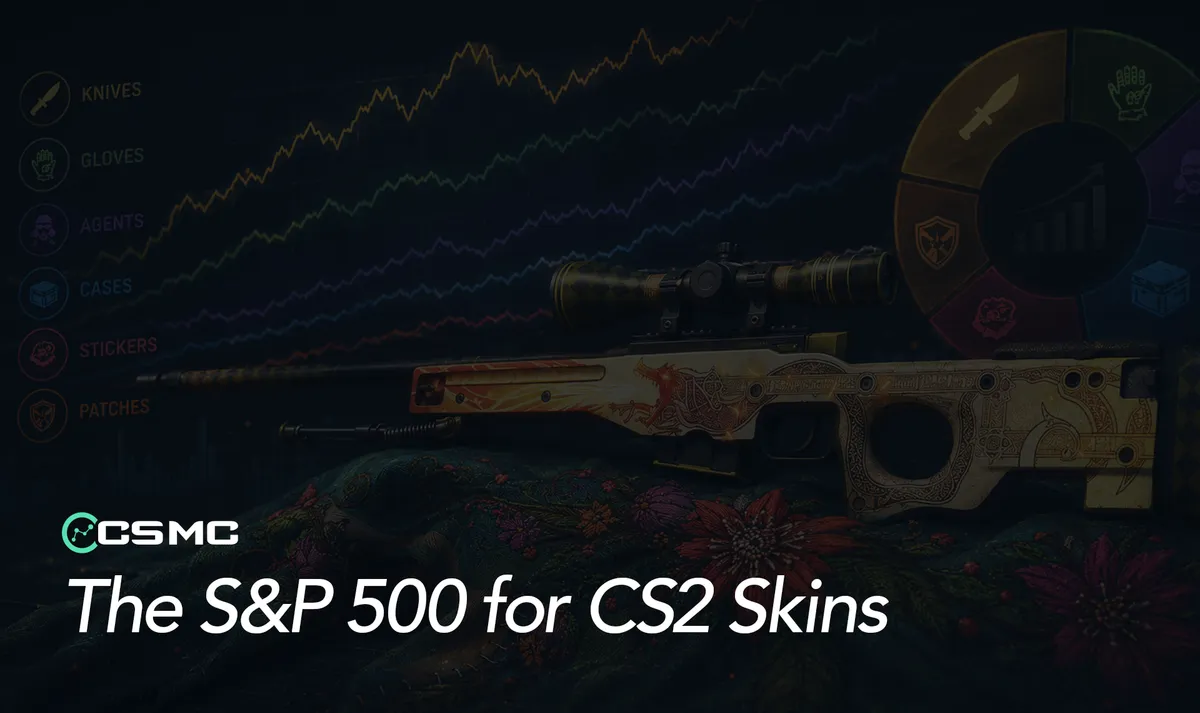
That's why we built CSMarketCap Skin Indexes — a set of category-level indexes covering knives, gloves, agents, cases, stickers, patches, and more. Each one tracks the combined value of every skin in that category over time, giving you a single number that captures the health of an entire segment of the market.
If you trade, invest, or just want to understand where the CS2 economy is heading, indexes are the fastest way to read the room.
What a CS2 Skin Index Actually Measures
An index is a basket. For each category — say, knives — we add up the price of one copy of every skin in that category, across every wear tier (Factory New, Minimal Wear, Field-Tested, Well-Worn, Battle-Scarred). The total is the index value. As prices move, the index moves with them.
This is an equal-weight basket — every skin and every wear contributes one unit. A single hyped item can't skew the line. The result is a neutral, structural read on what's happening across the entire category: not just the top movers, but the broad direction.
Think of it as "the price of one of everything" in that group.
The Indexes We Track
CSMarketCap currently runs indexes across every major CS2 item category:
Knives — the high-end speculative tier. Volatile, sentiment-driven, and the first to spike or crash during market events.
Gloves — historically tied to knives, but increasingly independent following the October 2025 trade-up update that made gloves accessible through five-Covert contracts.
Agents — small supply, often illiquid, capable of dramatic short-term moves. The Agents index has more than doubled in some two-month windows.
Cases — the supply-side fundamental of the market. Stable, scarcity-driven, and the most reliable long-term holds.
Stickers — tournament-driven, with rare capsule stickers like the Stockholm 2021 holos producing some of the most extreme percentage moves in market history.
Patches — niche but historically under-tracked. Useful for identifying collector-driven micro-trends.
Each index has its own historical chart, so you can compare not just current values but multi-month trajectories.
Why Indexes Matter for Traders
1. Spot Capital Rotation
When prices in one category rise while another drops, money is moving — not disappearing. If the Knives index is flat but the Stickers index is climbing, that's capital rotating out of high-end speculative items into tournament-driven plays. Indexes make rotation visible in a way single-item charts can't.
2. Read Market Direction Without Noise
A single skin can pump or dump on a tweet. An entire category cannot. When the Cases index trends up steadily for weeks, that's a real signal — supply is tightening across the board. When the Gloves index drops 40% in a week, you know it's not a one-item story.
3. Time Entry and Exit Decisions
If you're holding cases for a multi-year play, you want to know whether the Cases index is in an uptrend, a downtrend, or a sideways consolidation. If you're looking to enter the knife market, the Knives index tells you whether you're buying near a top or after a correction. This isn't gambling — it's reading data.
4. Compare Categories on Equal Terms
Each index is normalized to its own basket, but you can put them side by side to see relative performance. Did knives outperform cases over the last 90 days? Has the Agents index broken its previous high while everything else stagnated? Cross-category comparison is where real strategy lives.
What the Indexes Have Already Revealed
Historical data on category indexes tells stories that single-skin charts miss. A few examples:
The October 2025 trade-up update. When Valve enabled knife and glove access via five-Covert trade-up contracts, the Gloves index dropped over 40% in a week as supply expectations shifted. Individual gloves like the Bloodhound Charred fell 80%+, but you couldn't read the market-wide impact without the index. The recovery, which began within 30 days as panic selling exhausted, was visible in the index curve before most individual items stabilized.
The 2025 Agents surge. Between August and October 2025, the Agents index nearly doubled — driven by items like Maximus | Sabre going from $4.40 to ~$84 in three months. The index made the trend visible weeks before mainstream attention caught on.
The total market cap milestone. The broader CS2 market cap crossed $6 billion in October 2025, then corrected sharply within days. Indexes for each category showed which segments led the climb (knives, gloves, agents) and which lagged (cases, stickers) — giving traders a clear post-mortem on what drove the cycle.
How to Actually Use Indexes
The most useful framing is to treat each index like a stock chart. Look for:
Direction — Is the line trending up, down, or sideways over your timeframe of interest?
Higher highs and higher lows — classic strength signals. The opposite (lower highs, lower lows) signals weakness.
Volatility — A category index moving 3% a day is a different environment than one moving 0.3% a day. Match your strategy to the volatility regime.
Divergence — When the overall market cap rises but a specific category index falls, that category is underperforming and may either bounce back or continue weakening. Both outcomes are tradeable.
Breakouts — A category index pushing past its previous all-time high signals that demand is overcoming whatever supply ceiling was capping it.
Indexes Are Analytics, Not Predictions
One important caveat: indexes are historical data, not crystal balls. They show you what has happened across a category, which is far more reliable than what a single skin chart can tell you, but they can't promise what comes next. Markets are driven by Valve updates, esports cycles, content creator attention, and macro sentiment — all of which can change the picture quickly.
The value of indexes is reducing noise. When you stop reacting to single-item price swings and start watching category-level trends, your decision-making becomes structural instead of emotional. That's the edge.
Start Reading the Market Like a Market
Most CS2 traders never look beyond the item they're holding. They miss the rotation, miss the cycles, and miss the structural shifts that move whole categories. Indexes fix that. They turn the noise of 22,000+ individual skins into something you can actually read.
Explore the full set of category indexes — knives, gloves, agents, cases, stickers, and patches — at csmarketcap.com/indexes. Track direction, compare categories, and start trading the market instead of just the items.